


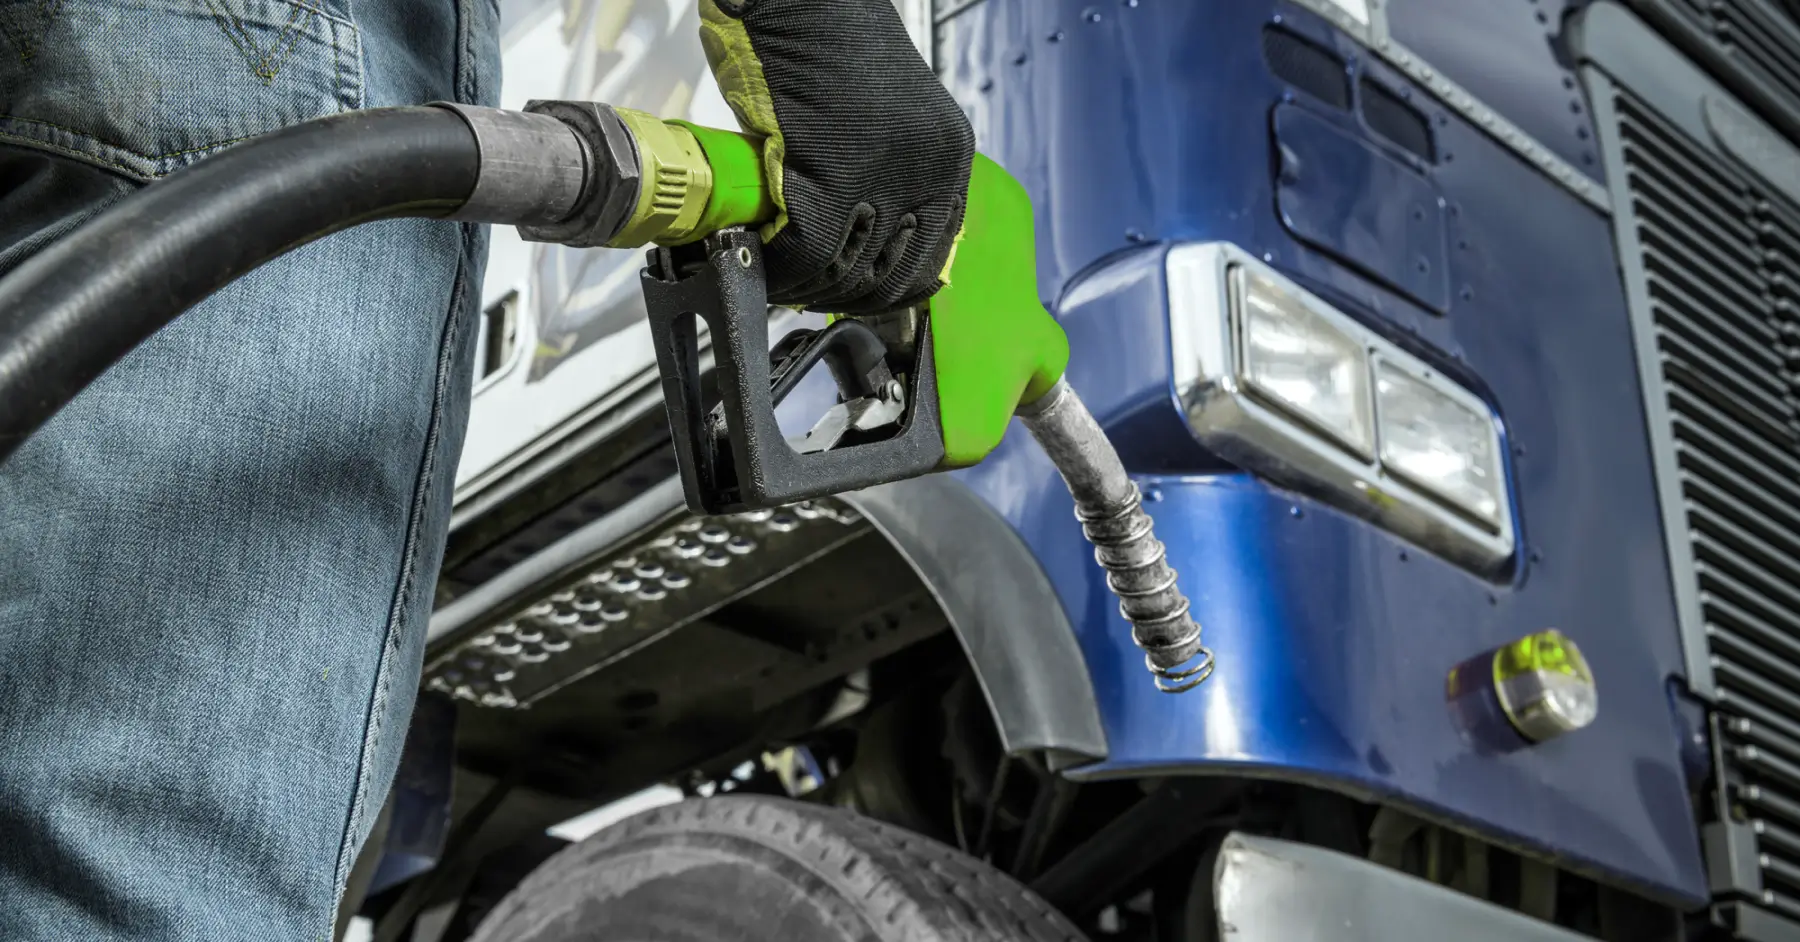

Fuel is by far the most costly part of fleet management, especially in transport and logistics. The average truck travels about 10 000 kilometres per month and consumes about 30 litres of fuel per 100 kilometres. This means that even a small change of 1 litre per 100 kilometres would result in fuel savings of 100 litres or more on the company’s balance sheet.
Using quality measurement tools and fuel management software enables businesses to detect and address issues such as fuel theft, unauthorized usage or inefficient driving behaviour that contribute to excessive fuel consumption. Let’s dig deeper and find out how!
How to Measure Fleet Fuel Consumption?
There are several ways to control fleet fuel consumption efficiency by using different types of equipment, including:
- Standard fuel level measurement data – the vehicle CAN bus;
- Fuel consumption sensor;
- High-capacity fuel level sensor.
The CAN bus is found on most modern light vehicles, trucks and tractors and is used to transmit fuel level information from the vehicle’s onboard computer to satellite monitoring systems. Meanwhile, the onboard computer receives the fuel-related data from the factory-installed fuel sensor.
Although the CAN bus provides a convenient way to access fuel consumption data, our experience shows that the factory-installed sensors can have an error of up to 15%, which contributes significantly to data inaccuracy. Additionally, the calculation doesn’t take into account the dead zones inside the fuel tank, which can be up to 10% of the volume, further increasing the error.
These limitations are why CAN bus data is primarily used for light vehicle fleets, while logistics and cold chain management companies are installing more advanced solutions, such as fuel flow meters and fuel level sensors in their fleets.

Fuel tank with the dead zone indications
From Simple Fuel Level Sensors to Advanced Technology
When Mapon started in the fleet management business 17 years ago, the primary concern for businesses was safeguarding their vehicles and fuel from internal theft attempts. To address this, we installed simple fuel level sensors in truck fuel tanks to monitor fuel levels, quantity, and consumption. These sensors had a data inaccuracy of around 3%, which was attributed to the hardware itself, the calibration process and the refuelling data.
This was fine in the beginning, but as the market evolved and fuel prices increased, such inaccuracies didn’t meet the clients’ needs anymore, and hardware manufacturers had to quickly adapt to new market requirements. They did this by introducing fuel level sensors with a digital interface and the ability to take variables, such as fuel temperature, into account when making measurements. Our calculations show that the
introduction of modern sensors to logistics fleets has resulted in data accuracy of around 1%, allowing companies to reduce unaccounted-for fuel from 30 litres to 10 litres in a 1000-litre tank on a single truck.
Imagine the importance of this data for fleets of 10, 100 and 1000 vehicles!
Fuel Level Sensor And Tank Calibration – Key To Getting Precise Data
There’s another important thing that needs to be done to ensure precise fuel consumption data – calibration of the fuel level sensor. It’s important because:
- Inaccuracies can occur over time such as sensor drift, changes in fuel properties, and tank shape. Calibration minimises errors and provides more reliable and accurate data on fuel usage.
- It establishes a sensor base reference point to provide consistent and accurate readings across different vehicles or over time. This is crucial for tracking fuel consumption trends and identifying anomalies/inefficiencies within the fleet.
- It enables fleet managers to identify and address excessive fuel consumption, monitor fuel efficiency improvements, and take action to reduce fuel waste.
- It provides accurate baseline fuel levels and monitors deviations from expected fuel consumption trends, enabling proactive measures to prevent fuel theft.
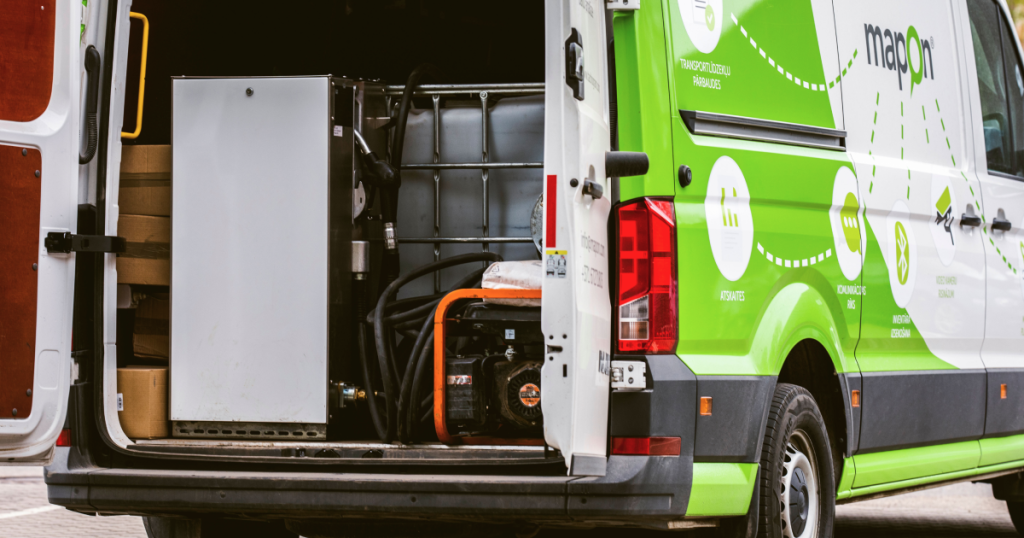
Fuel level sensor calibration equipment in the Mapon technician’s van
Modern Technology Means Fast Installations
There are multiple benefits to upgrading your fuel management toolbox. Apart from getting precise, high-quality data, modern technology is also saving time on fuel level sensor installations, which means we can do our work faster and your trucks can return to duty sooner.
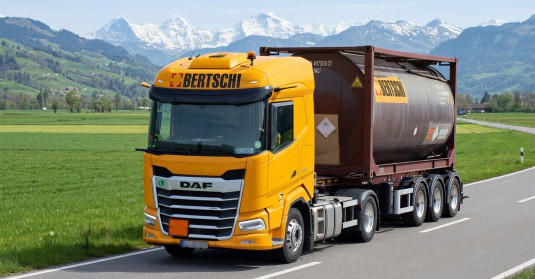
For example, our calculations estimate that it used to take up to 6 hours to install and calibrate two fuel level sensors on a DAF XF series truck with a full tank capacity of 1485 litres. Today, with our calibration system, we can do it in 2.5 hours. This means that any of our technicians can do three installations a day, instead of just one. It also means cost savings and a faster return on investment for our clients.
Helping To Prevent Fuel Theft
Precise consumption data can help improve fuel economy. However, it’s not enough to tackle one of the ever-present business challenges – fuel theft prevention. The recent energy crisis brought fuel prices to unprecedented heights, which, in turn, led to an increase in fuel theft, especially, in parking areas or other unprotected locations where drivers are having their rest periods.
To help our customers protect their assets, our team has developed a fuel level monitoring system that works while the vehicle is parked. The system functions thanks to additional fuel sensors that monitor the fuel level and sound a loud alarm when there is an attempt to drain the fuel.
Combining Fuel Management with Other Fleet Management Solutions
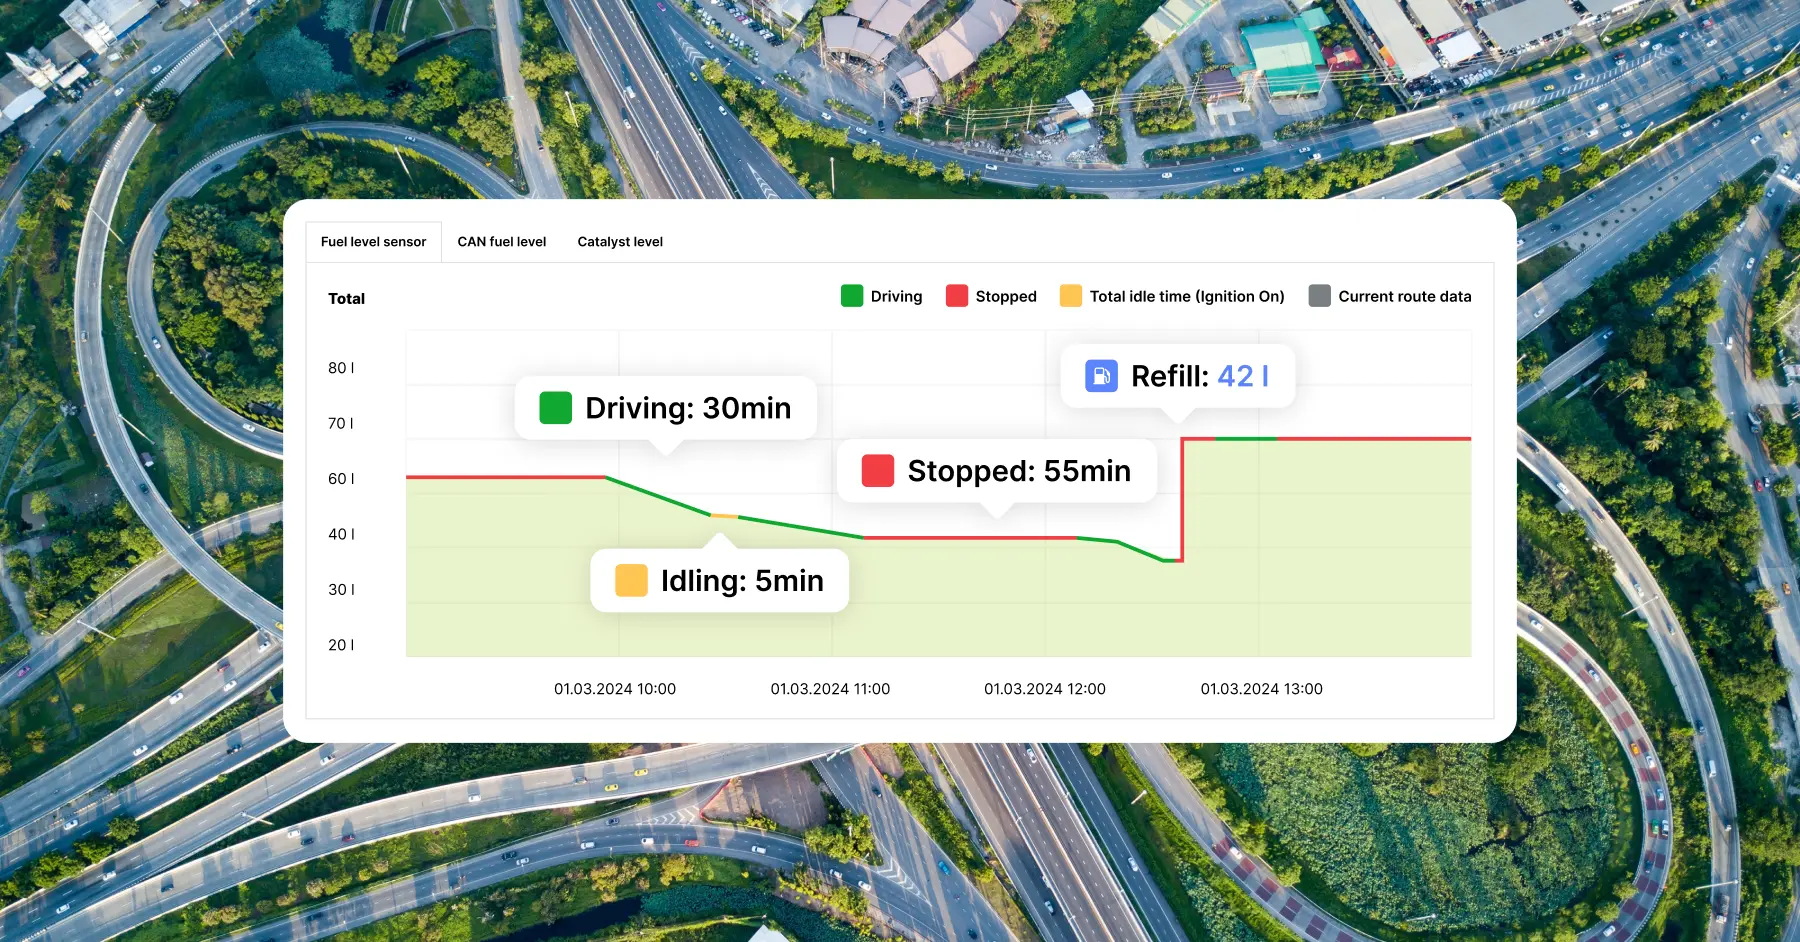
As you can see, there are many components that make up a good fuel management system. However, it’s not only about looking at the amount of refilled and drained fuel in a graph anymore. We can see that both business owners and drivers are more interested in installing additional hardware and software to:
- Calculate precise route costs for their clients;
- Improve driving culture within their fleets;
- Contribute to sustainable business practices by reducing CO2 emissions, etc.
Vehicles are also getting smarter and more modern, so operating them in the most efficient way possible is a science in itself. This is where other telematics solutions, such as driver behaviour analysis, can complement your fleet fuel management system.
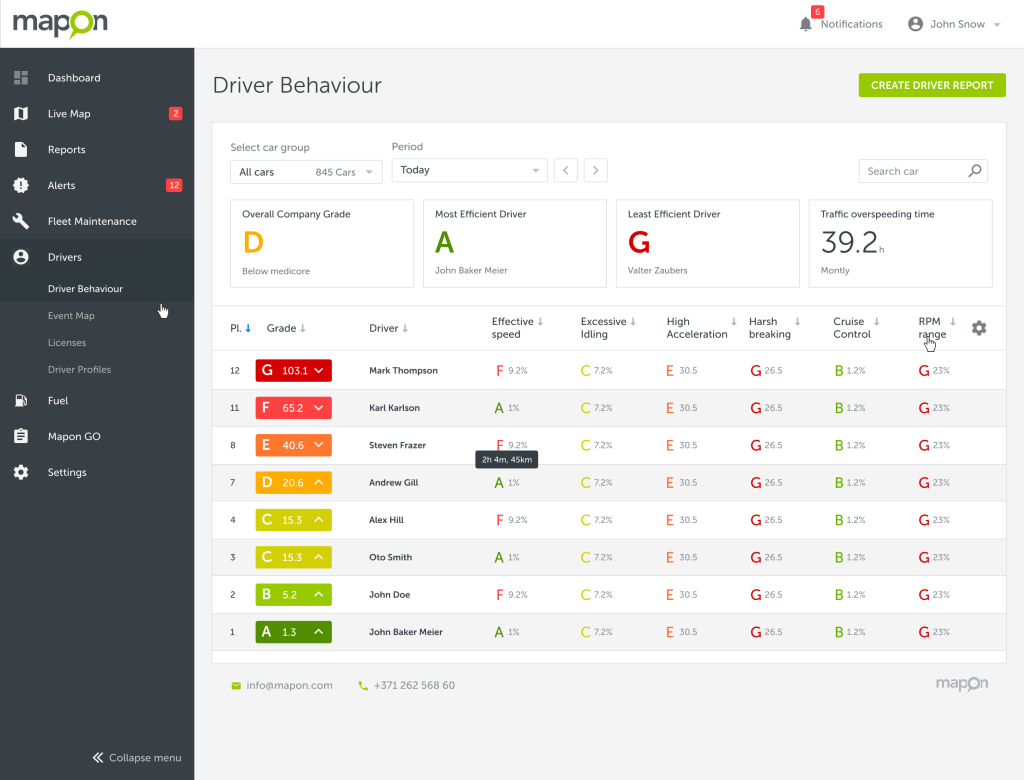
Driver behaviour analysis dashboard on the Mapon platform
For how long did the truck idle? Where and at which point on the route did the driver exceed the speed limit? How long was the driver overspeeding? Was cruise control used? How much fuel did the truck use with the PTO switched on? These questions are all directly related to fuel consumption.
Let’s take a look at a more specific example here. Data shows that reducing speed from 90 km/h to 80-85 km/h can save up to 20% fuel.
So, if your truck travels 10 000 km a month, not going eco speed would cost you 600 litres of fuel each month.
Given the current fuel prices, you can imagine just how significant that would be.
It’s also worth noting that some countries, such as Germany, France and Sweden, have introduced an 80 km/h speed limit for trucks, meaning that exceeding this limit will not only cost you more in fuel but could also result in a hefty fine.

Fuel is and will always be at the top of fleet management costs, no matter if it’s petrol, diesel, LPG, LNG or, in the future – electricity. Technology will also change, bringing in new ways to measure efficiency, but one thing will remain – the desire to make the most out of company resources through smart optimisation and taking care of teams and communities. Let’s work on your fleet fuel economy challenges together – give us a call at +371 67271803 or sign up for a free Mapon platform demo with our team today!
FAQ
What’s a fuel management system?
How does the fleet fuel management system work?
What are the benefits of fuel management systems?
How do fuel level sensors work?
What kind of fuel management solution do I need?
How does Mapon fuel monitoring solution work?