


If you’ve ever unloaded cargo only to find overripe fruits, sprouting vegetables, or discoloured shrimps, you know firsthand the consequences of temperature mishaps during transportation.
For those in cold chain management, maintaining the correct temperature is vital for business success. In this article, we’ll delve right into the details of temperature monitoring in logistics, including the most significant challenges and ways to overcome them using temperature graphs.
Temperature Monitoring in Logistics: Top 3 Challenges
Incorrect Unit Setpoints
One big problem for transportation companies is when the temperature settings on their refrigeration units are wrong.
Imagine a scenario where a shipment is supposed to be stored at +2°C, but due to human error, the unit is set at +22°C. Mistakes like this happen far more often than you might think.
Another frequent mishap is missing or adding an excess decimal point – instead of working at +6°C, the reefer is being operated at +0.6°C etc. Mistaking positive numbers for negative ones and setting temperature for -6°C instead of +6°C is also a common issue.
Similarly, equipment malfunctions such as dead pixels on the control panel display can also lead to incorrect temperature settings.
Whatever the reason, deviating from the desired parameters puts the quality of the transported goods in danger. Remote temperature monitoring in logistics can save the situation because the manager will detect such mistakes and contact the driver.
Incorrect Unit Modes
Refrigerated products can be transported in two different modes – continuous mode and start-stop mode. Opting for the wrong mode will lead to temperature-related issues during transit.
In continuous mode, the refrigeration unit operates without breaks. Once the desired temperature is reached, the unit transitions into a low-speed cooling mode while still ensuring optimal temperature control. This mode is typically preferred for transporting perishable goods, as it helps prevent temperature fluctuations that could compromise the quality of the cargo.
On the other hand, start-stop mode operates intermittently, where the refrigeration unit turns on and off periodically to regulate temperature. While suitable for certain cargo types, such as non-perishables, it poses risks for delicate goods.
Because of temperature fluctuations in the start-stop mode, certain areas of the shipment may experience “top freezing” – the uppermost layer of goods freezes more while the rest remains at the set temperature. This can cause damage to sensitive products like fruits, vegetables, or dairy items.
Warm Loads
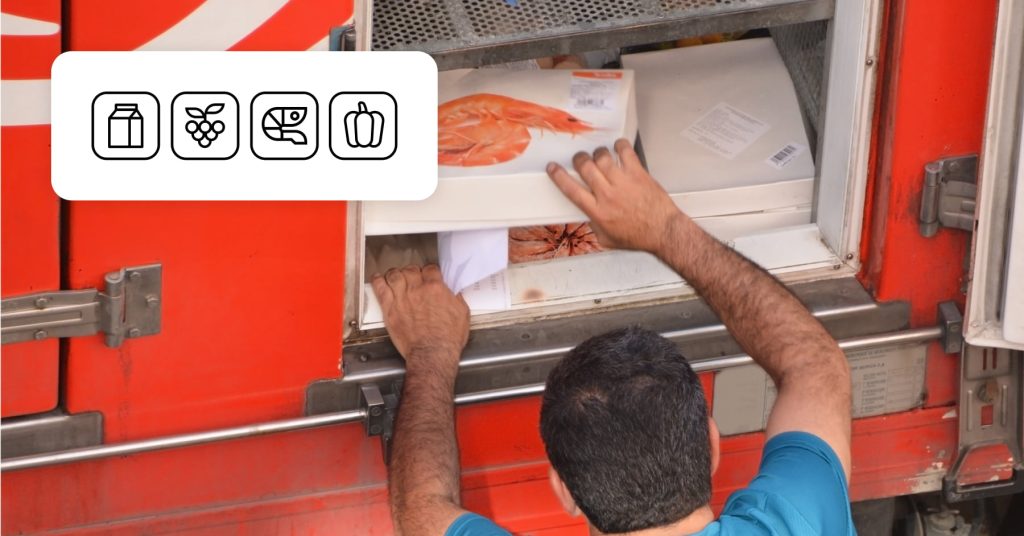
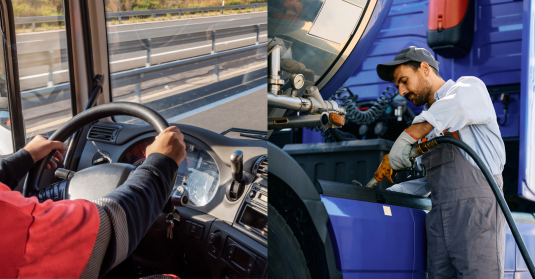
A wide range of products – fruit, vegetables, dairy, seafood, and more – need to be loaded at the right temperatures to keep cargo fresh during transportation.
Let’s say you’re shipping a batch of fresh seafood for export. If this seafood isn’t properly chilled before loading it onto refrigerated trucks, most likely it won’t make it to shop shelves.
Without that initial cooling, the seafood stays susceptible to temperature swings and it can lead to spoilage or contamination. In situations like these, any mishaps in temperature monitoring in the cold chain can mean big losses for both the supplier and the recipient. That’s why it’s crucial to ensure smooth and reliable cold chain management.
So how do you do it?
The secret to reliable deliveries is the right work with data – namely, temperature graphs.
Read on to learn how to interpret cold chain monitoring graphs correctly!
How Refrigerated Units Work
When you look at cold chain monitoring graphs in the Mapon platform, you’ll see different curves for different air flows – this is what temperature monitoring in logistics looks like. To navigate these graphs, fleet managers and drivers need to understand the working principle of refrigerated trailers.
The refrigeration unit expels cold air from the top and this air circulates through the cargo, enveloping the products. The air then travels towards the back doors, absorbing heat from the items along the way.
Upon reaching the back doors, the air descends, eventually reaching the floor and continuing to absorb heat from the products. This process of circulating air, absorbing heat, and returning to the unit is commonly referred to as “return air.”
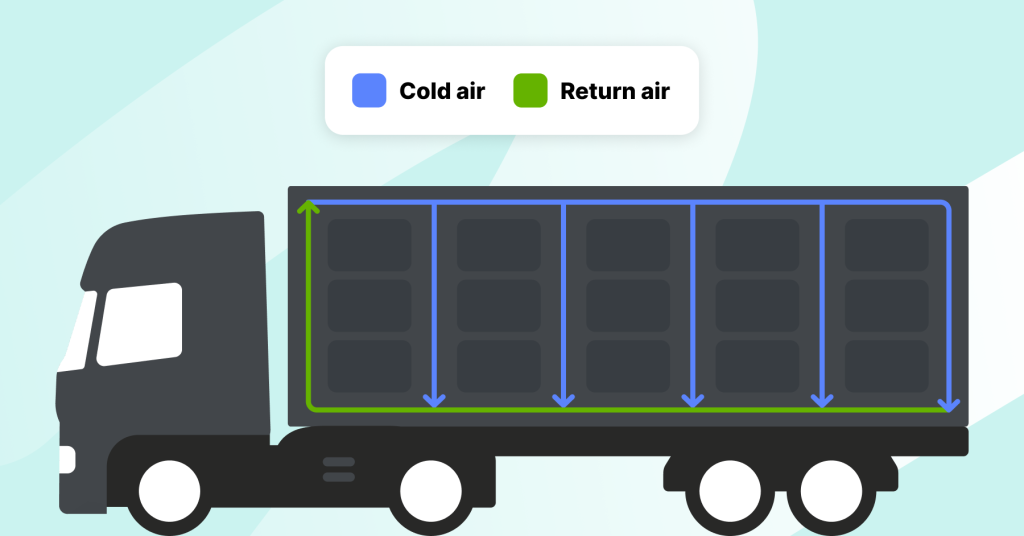
Blue colour – cold air; green colour – return air.
Return air temperature represents the actual temperature of the product and temperature monitoring in logistics can give valuable information about whether the product was at the correct temperature upon loading.
Read Cold Chain Graphs Correctly
When products are loaded at the correct temperature, the return air temperature should quickly drop to the setpoint temperature after the doors are closed.
Take a look at the graph below to see how to monitor the temperature in a cold chain cargo:
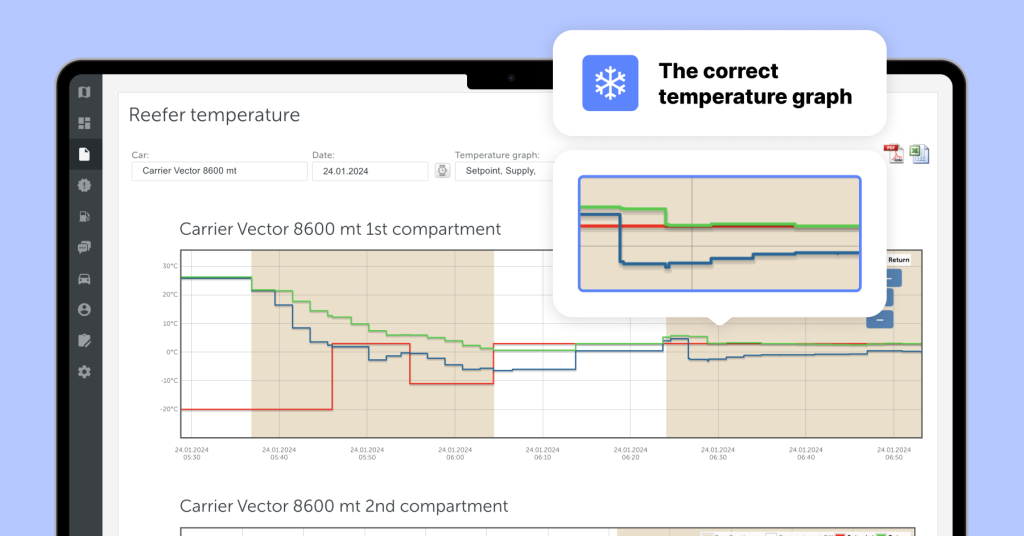
Product at the correct transportation temperature – after the loading is finished and the doors are closed, the green line (return air temperature) drops to the level of the red line (the setpoint temperature) in a very short time.
However, if products are loaded warm, it can take significantly longer for the refrigeration unit to cool them down, leading to higher fuel consumption and potentially compromising product quality.
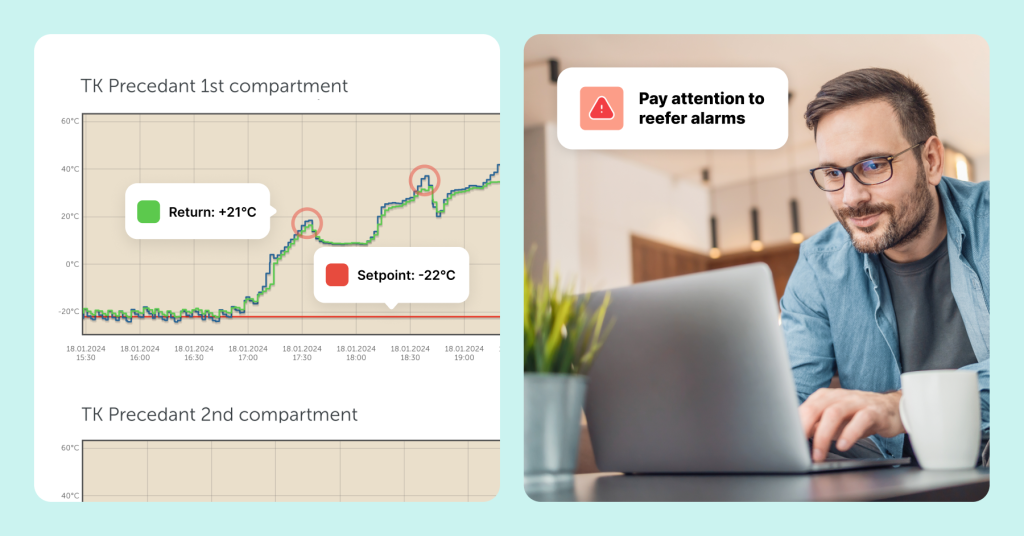
Here is an example of how temperature monitoring in logistics can detect a warm load:
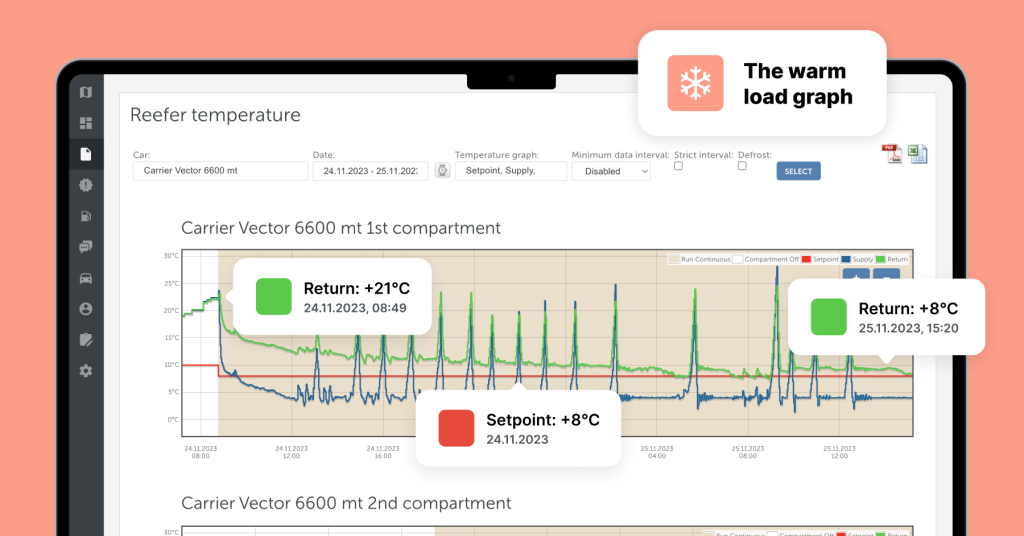
The transportation temperature of this product is set at +8°C. The return temperature (green line) after loading the product is 21°C. In this example, it took 2 days for the refrigerated trailer to pull down the product temperature to the setpoint.
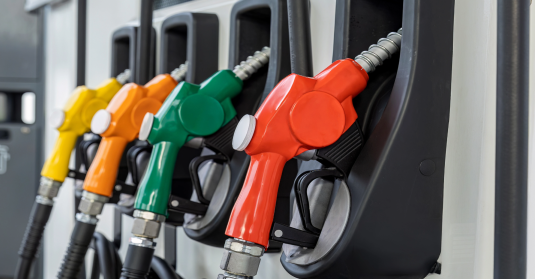
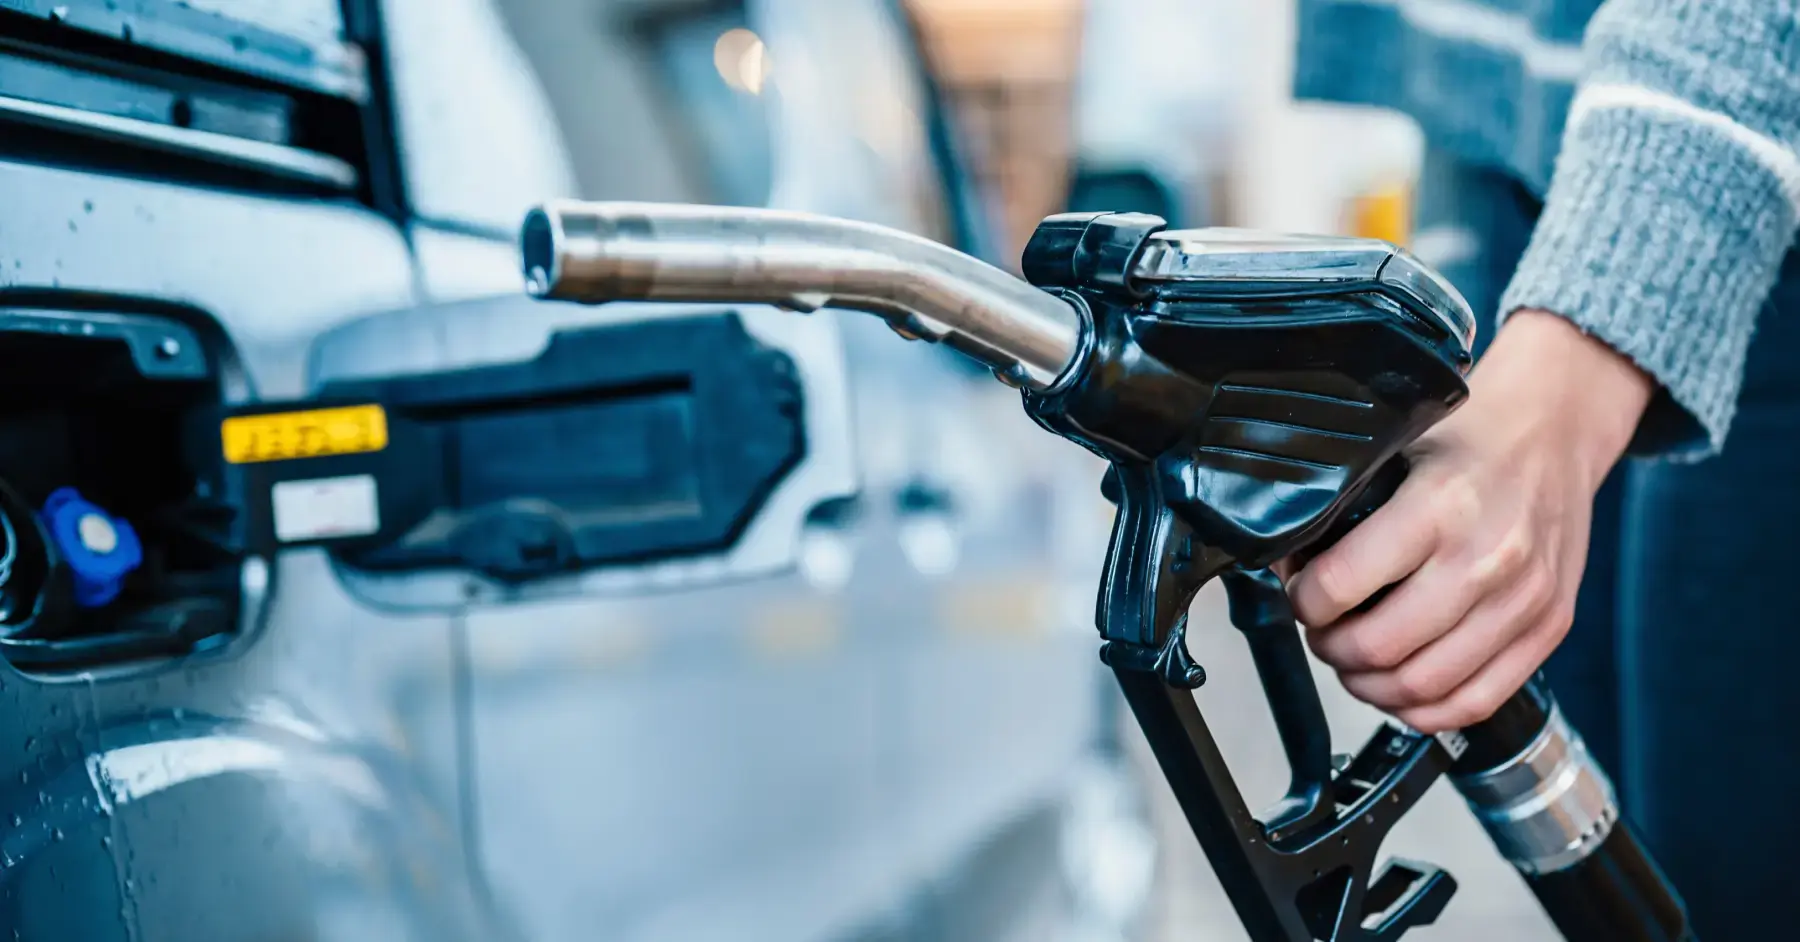
Fuel Consumption in Cold Chain
When the product is at the right temperature, the refrigeration unit consumes about 1.1 litres of fuel in one hour. By contrast, if the refrigeration unit is working at max power to pull down the product temperature to the setpoint, the fuel consumption is about 4.1 litres in one hour.
If we use the warm load example above, the refrigerator spent 3 times more fuel to pull down the product temperature than it would if the product were in the correct temperature during loading.
In our example, fuel spending is:
- 52 litres in 2 days if the product is at the correct temperature before loading
- 196 litres in 2 days if the refrigerator is working non-stop to pull the temperature down
The difference is obvious, isn’t it?
To save fuel, you need to monitor the temperature in a cold chain delivery starting from the loading.
Make sure that cargo is already cooled when loaded – and if that’s not the case, you should address the cargo supplier and let them know that their products were not at the right temperature.
Monitor Everything That Matters
To address these issues, implement geo-fencing at pick-up points to trigger alerts in the platform when the goods leave the designated area.
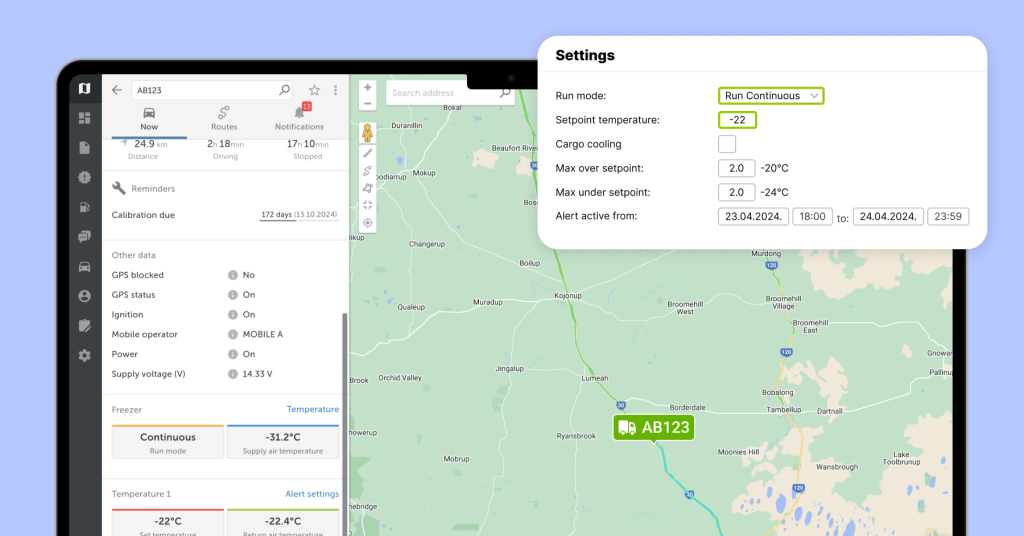
By introducing temperature monitoring in logistics, fleet managers can then review important parameters like unit setpoints, unit run mode, and product temperature.
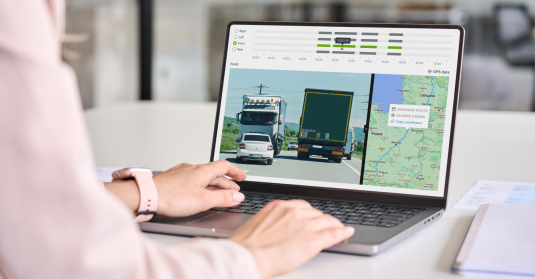
Here is an example of temperature report data after the reefer alarm is sent via the Mapon platform. The client can make a data-based decision to load the cargo in a different trailer before it gets spoiled.
Moreover, If a warm cargo is detected, the Mapon system sends in-built alerts informing when to lower the temperature to cool the cargo correctly.
Train your managers and drivers to perform temperature monitoring in cold chain deliveries. Your company is not liable for spoiled cargo if the product was never cooled to the correct temperature at the point of pickup. Armed with temperature graph data, you can get back to the supplier and say the product had not been cooled properly.
Mapon Ensures Effortless Temperature Monitoring in Logistics
Mapon has extensive experience in cold chain logistics and can help you streamline operations and maintain product integrity even in the most challenging markets – including pharmaceuticals and perishable foods.
Contact our team to learn how to integrate Mapon cold chain monitoring solutions in your daily operations!