


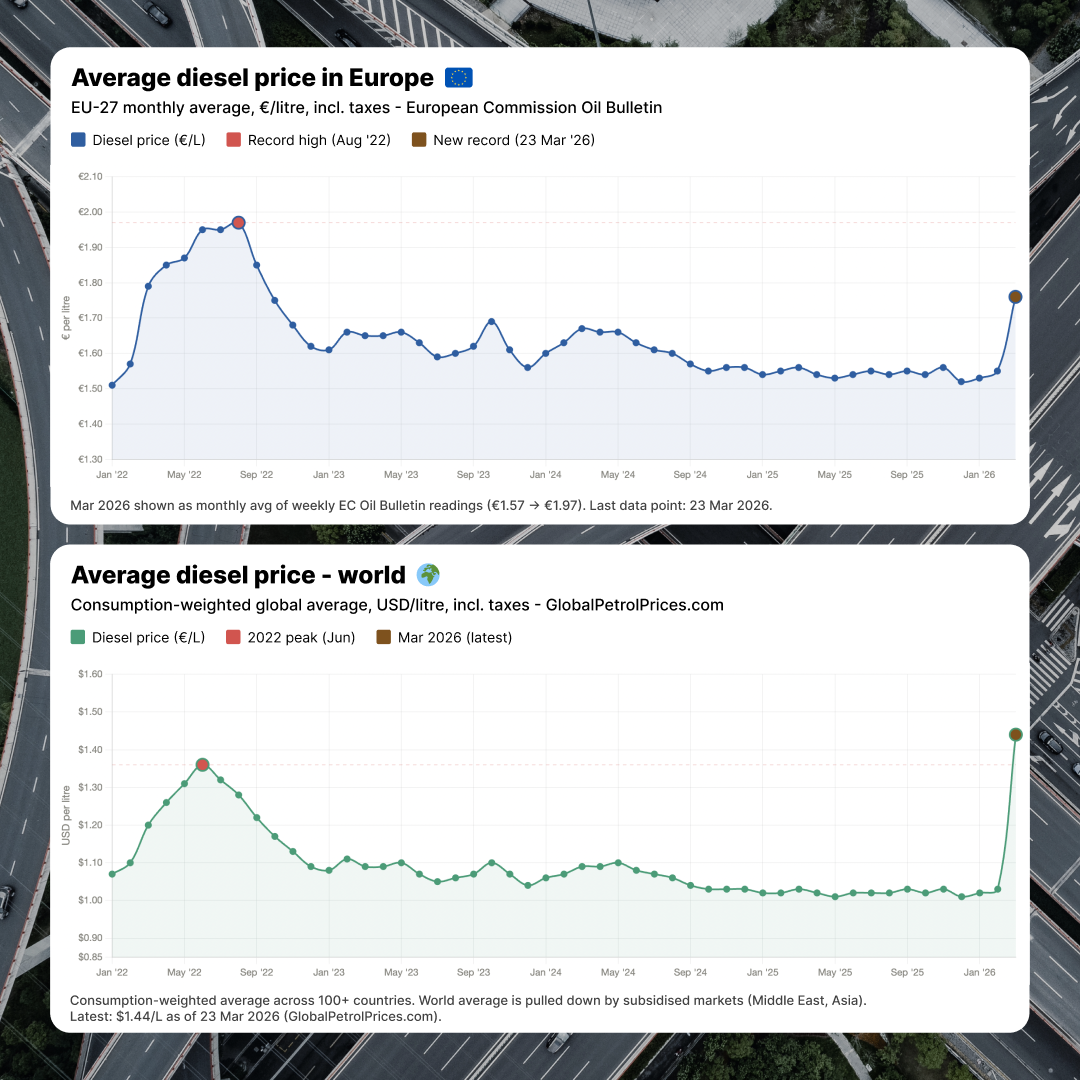
Here we go again.
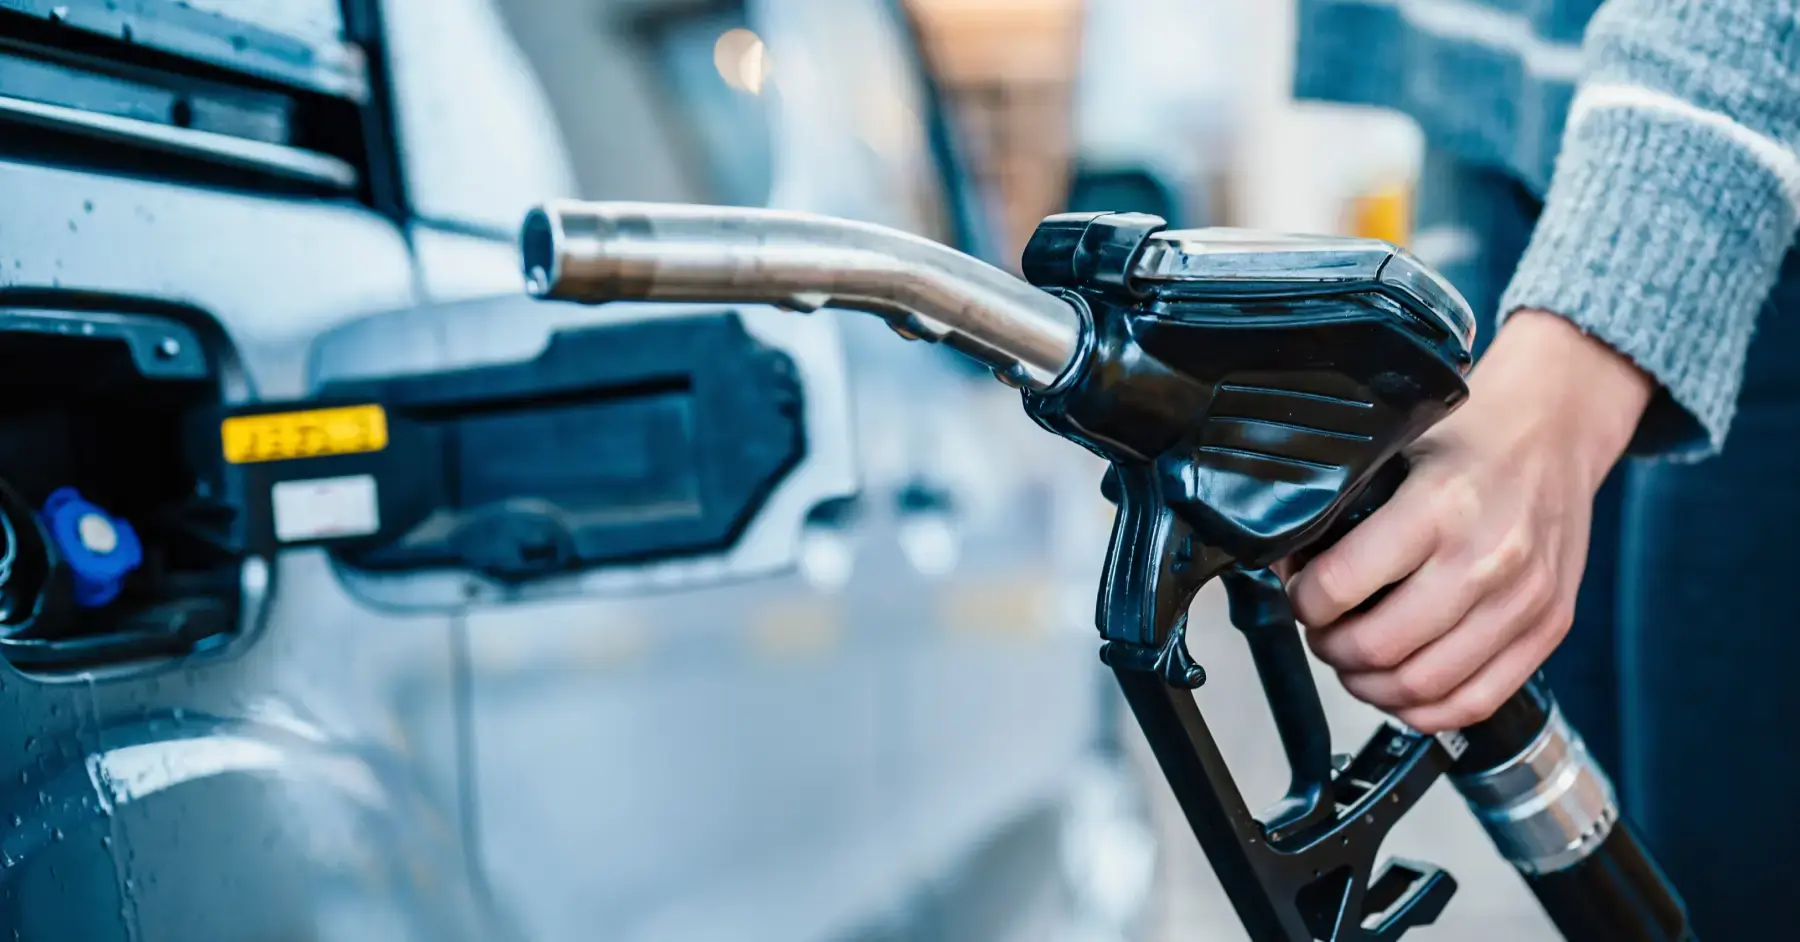
Fuel prices are rising. The market is volatile. One week things look stable, the next your fuel costs are up, and suddenly every route, every delivery gets a bit more expensive. In the midst of all this, fleet owners can’t help but wonder – what to do?
And while there are things you can’t control, how you run your business comes down to small, effective decisions that help you stay competitive, especially when others are simply waiting for the storm to pass.
And let’s face it – saving a few cents per litre with flashy AI solutions won’t make a real difference if inefficient driving is quietly costing you 10–20% of every tank.
The real issue is that fuel losses rarely come from one obvious problem. Instead, they build up over time through everyday habits, unnoticed discrepancies, and decisions that seem small in isolation but add up across a fleet. There is no quick fix – only visibility, understanding, and consistent action.
The companies that stay ahead are the ones that:
- see where fuel is going
- investigate what doesn’t add up
- and take action based on real data
In this article, we’ll walk through a practical, step-by-step approach to doing exactly that – from identifying hidden inefficiencies to taking action that leads to measurable savings.
1. Costly driving habits and fuel theft – where your money is at risk
1.1. Inefficiency becomes expensive faster than you expect
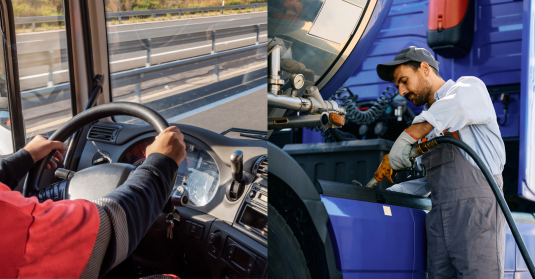
Drivers do their job. Deliveries get completed. Everything runs smoothly – until you get a glimpse at the data behind it all.
- Idling for one hour can burn (on average) up to 4 liters of fuel.
- Rapid acceleration, harsh braking, and unnecessary speeding can increase fuel consumption by 10-20%.
- A route that’s “always been used” might just be 20-30 km longer than necessary.
An unnecessary 5-10 liters per day per vehicle isn’t unusual when these factors combine. At around €1.70-1.80 per liter, that’s roughly €8-18 per day, or €250-500 per month per truck. And that’s under normal market circumstances.
1.2 Fuel theft becomes a real issue
It doesn’t always look dramatic. Sometimes it’s small discrepancies at refueling, fuel that slowly “disappears”, or mismatches between what was purchased and what actually ends up in the tank.
But it adds up.
Industry data shows fleets can lose 5–10% of fuel this way if it’s not properly monitored. For a fleet spending €100,000 per month on fuel, that’s €5,000–€10,000 lost every month, often without anyone clearly seeing where it went.
And sometimes, it’s very direct. One Mapon client shared this:
“We stopped for the night in Germany and dozed off in the cab. Suddenly, the Mapon fuel alarm went off across the whole parking lot. Someone had already started siphoning diesel. They only managed 63 litres before the alarm scared them off. We saved nearly a full tank.”
That’s the difference visibility makes - not just tracking fuel, but protecting it.
1.3 Why waiting it out doesn’t work
When fuel prices spike, fleets don’t struggle equally. Some rely on basic tracking or occasional checks. Others have real-time data and can react immediately.
And over time, those different approaches lead to very different outcomes.
Take three common scenarios:
Company A decides to wait it out. They absorb the initial increase and hope the market stabilises soon.
In the meantime, their costs keep rising. Margins shrink, and price adjustments become inevitable – not once, but repeatedly.
Company B reacts by tightening control. They start checking routes more closely, questioning fuel usage, calling drivers, and trying to keep a close eye on everything.
It quickly turns into constant pressure. Managers are chasing answers, drivers feel monitored and pushed, and time is spent investigating instead of improving. Despite all the effort, the real causes remain unclear, and the situation doesn’t actually improve.
Company C takes a different approach. They introduce proper fuel visibility – not just tracking, but understanding.
They can spot anomalies as they happen, see which behaviours or routes drive consumption, and make adjustments based on real data.
Over time, that changes how the whole team operates. Fuel use becomes something that’s understood, not guessed. Decisions become easier to justify. And improvements happen continuously, not reactively.
Meanwhile, the gap between these companies keeps growing. Because when margins are tight, even small inefficiencies compound quickly, and the fleets that adapt early are the ones that stay competitive.
2. A practical playbook: how to take control with Mapon fuel management
2.1 See where fuel is going
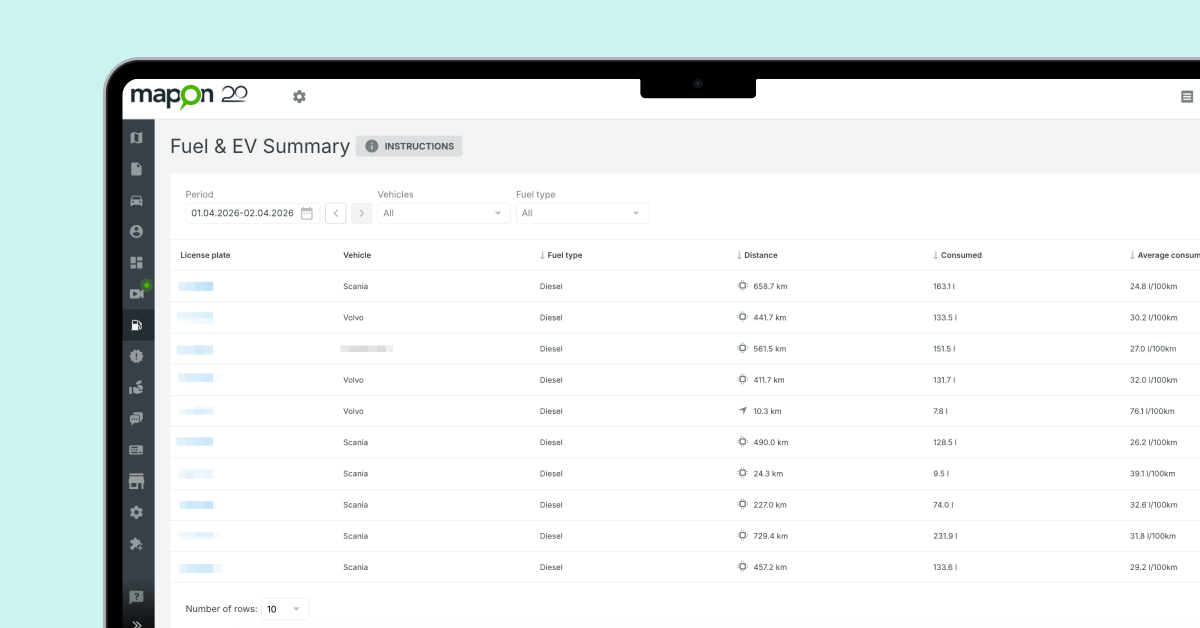
The first step is understanding the bigger picture. Mapon’s Fuel & EV Summary brings all fuel data into one place across all vehicles and fuel types, from diesel and petrol to LPG, LNG, and electric. This allows managers to immediately see how much each vehicle consumes and how efficiently it operates.
However, what many fleets discover at this stage is that simply having data is not enough, as not every stray indicator means that there's an issue. In practice, fuel consumption is rarely consistent. The same vehicle can show very different results depending on workload, terrain, weather conditions, or the operator behind the wheel. However, knowing your fleet and working together with the data, you can quickly learn to recognise what’s normal, what isn’t, and where intervention is needed.
2.2 Notice something doesn’t add up? Investigate
Once something looks off, the next step is to understand why. In practice, this usually comes down to three key checks:
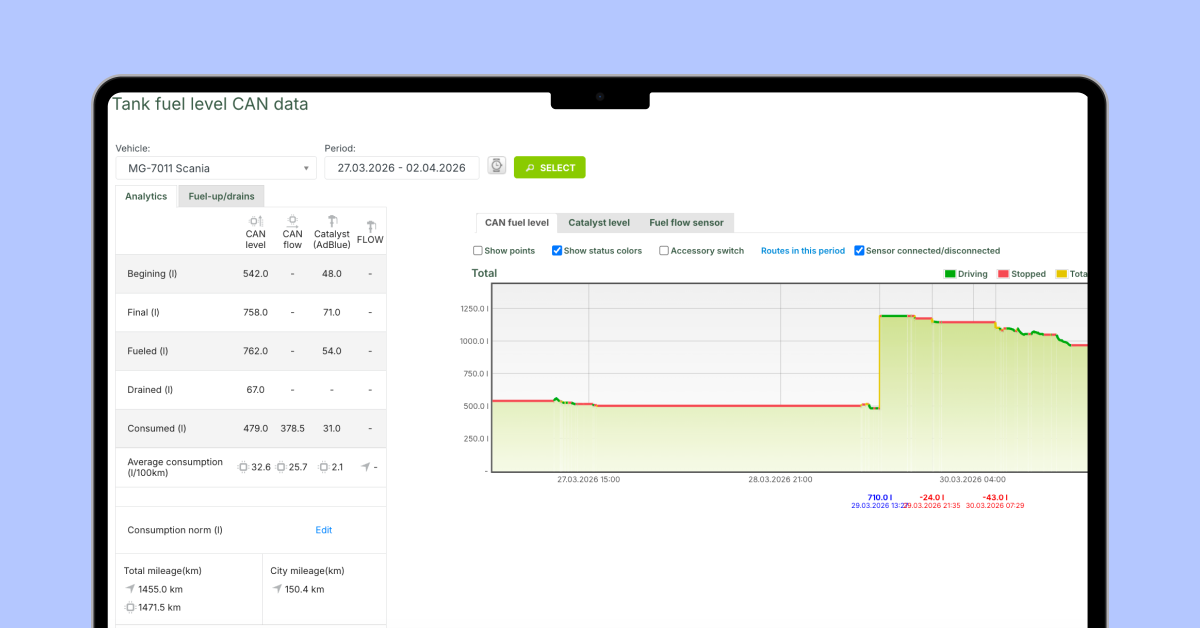
(A) First, it’s important to verify whether fuel is actually missing. By viewing Fuel Chart graphs together with fuel receipt data, managers can compare what was purchased with what entered the tank, and whether at any point a portion of the fuel suddenly decreased.
This makes it possible to detect both theft from the tank and discrepancies at refuelling, even small ones that would otherwise go unnoticed.
For example: 180L purchased, but only 160L shows in the tank. A small difference that’s easy to dismiss as a system error until you have the receipt to confirm it. With Mapon, this refuelling info can be brought into the system automatically, including integrations with major fuel providers such as Circle K, Viada, Repsol, Olerex, Neste, Virši, and Alexela.
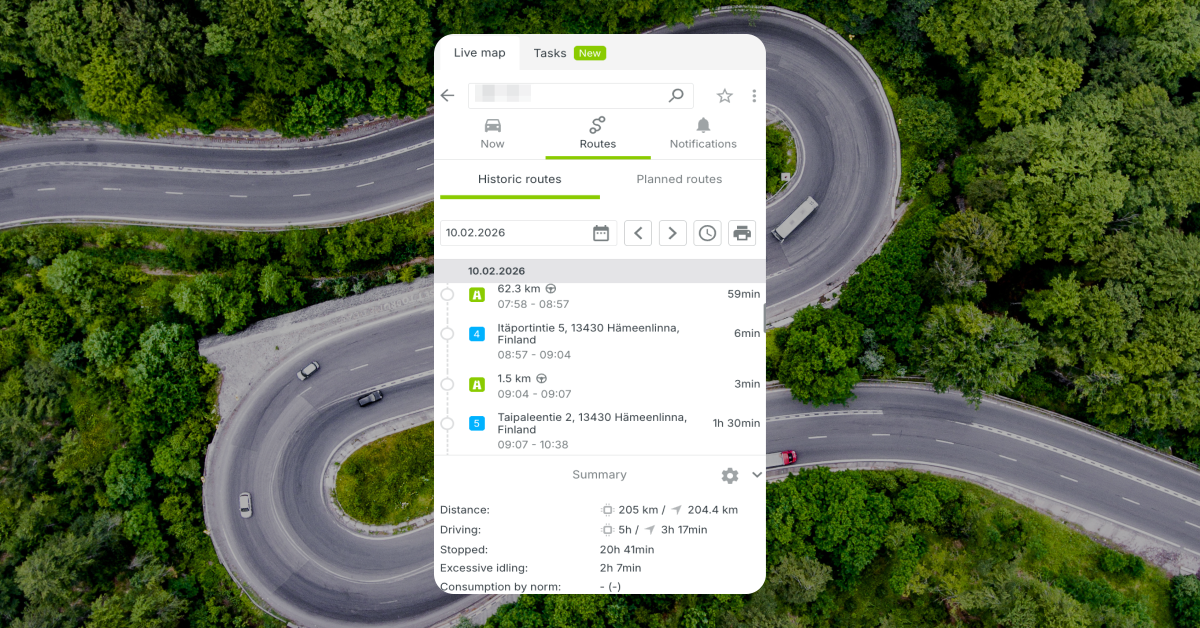
(B) Second, the context of the journey needs to be reviewed. Route History provides visibility into where and how the vehicle was used, including distance, terrain, stops, and delays. What might initially look like excessive consumption could be explained by more demanding routes or operating conditions. In the case of construction equipment, a significant share of fuel may also be used through PTO, i.e. when machinery is doing work while stationary.
(C) Third, driving behaviour should be analysed. Fuel consumption is heavily influenced by how a vehicle is driven. Harsh acceleration, unnecessary idling, and inconsistent driving patterns all increase fuel use and costs. Research shows aggressive driving alone can increase fuel consumption by over 20%, making driving behaviour one of the most important factors to assess.
Looking at these three areas together allows managers to move from assumptions to understanding. Instead of guessing, they can identify whether the issue is operational, behavioural, or something else entirely.
2.3 Take action
Once the cause is clear, the next step is acting on it. This is where fuel management moves from insight to real impact.
(A) Address fuel misuse and theft
When discrepancies point to fuel loss, action needs to be direct. This can mean reviewing specific cases with drivers, setting clear internal policies, or responding to external risks such as theft at parking locations.
What matters most is not just detecting these events, but acting on them consistently. Visibility creates accountability, and once teams understand that fuel usage is monitored and verified, behaviour naturally begins to change.
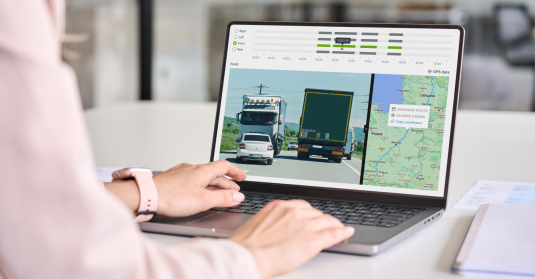
Did you know? Video telematics adds an extra layer of protection by acting as a deterrent for potential fuel theft instances. And if it does happen - you have proof!
(B) Improve driving behaviour
In many cases, the biggest savings don’t come from fixing one major issue, but from improving everyday habits.
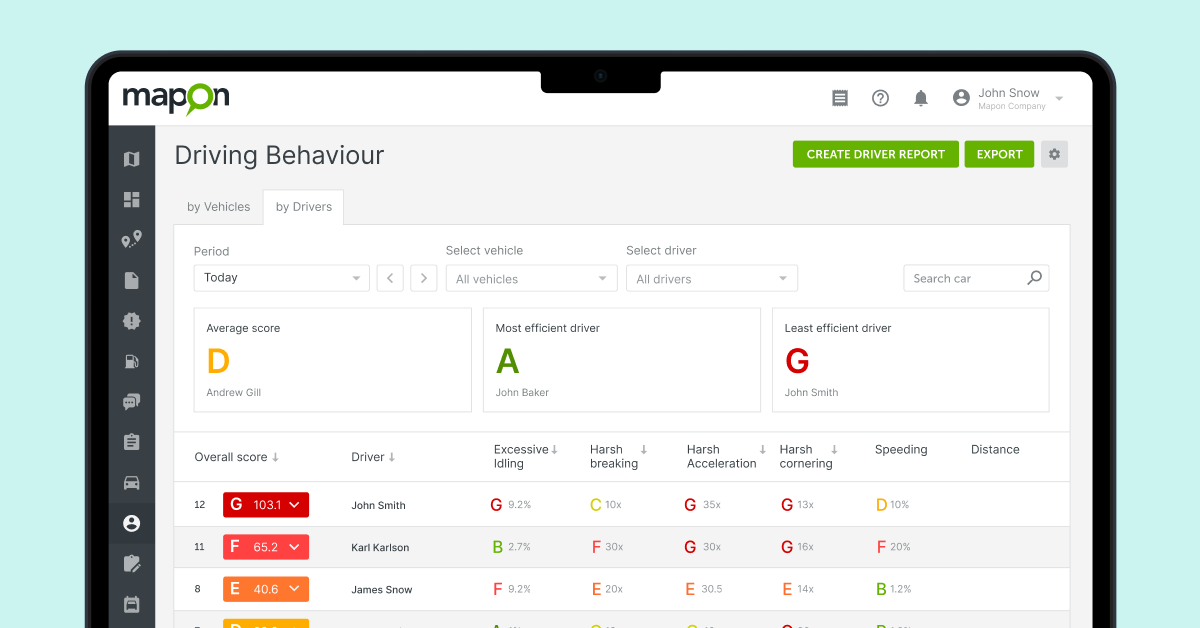
Start by identifying which drivers need attention. Mapon’s Driving Behaviour scoring gives you a clear, at-a-glance view of how each driver is performing, making it easy to spot who is driving efficiently and who is not.
From there, focus on the specific behaviours that drive fuel costs. Look for patterns such as excessive idling, harsh acceleration, or aggressive braking – these are the actions that add up over time and increase fuel consumption across the fleet.
Once the issues are clear, take action with targeted coaching. Instead of general feedback, use real data to show drivers exactly where improvements are needed. Comparing drivers operating under similar conditions can be especially effective, as it highlights differences that would otherwise go unnoticed.
“After using driving behaviour monitoring for one month, fuel use dropped by 5.2 L per 100 km. This driver covers around 3,000 km every week. With fuel costing around €1.80 per litre in Finland, the improvements translate into more than €1,000 saved every month.” – Mapon client
Many companies take this one step further by introducing incentive programs. Drivers who maintain high efficiency scores or show measurable improvement are rewarded, most often financially. This turns fuel efficiency into a shared goal, where both the company and the driver benefit from better performance.
“We want to encourage drivers to drive efficiently and safely, and to address any potential issues with driving habits. This is possible through regular monitoring. We reward our top-performing drivers based on Mapon’s driving behaviour analysis, and this has fostered a healthy sense of competition within the company,” – Mapon client
(C) Turn data into a daily habit
One thing becomes clear very quickly: data alone doesn’t change anything. Results come from using it consistently.
Fleets that see the biggest improvements are not the ones that check reports once a month, but the ones that:
- review data daily
- understand what “normal” looks like
- act early when something gets off track
Over time, this creates a different way of working. Fuel is no longer just a cost, and consumption becomes something that is actively managed, understood, and continuously improved.
The takeaway
Fuel prices will always fluctuate – that part is out of your control. But how your fleet responds to it isn’t.
If there’s one thing to take away from this: The more visibility you have, the more control you keep, no matter what happens to fuel prices.
With Mapon, that visibility comes from combining sensor data, trip context, and fuel purchases into one system - so you’re not guessing where fuel goes, you can actually see it.
Want to see where your fuel is actually going? Get in touch with our team and we’ll show you how it works in practice.