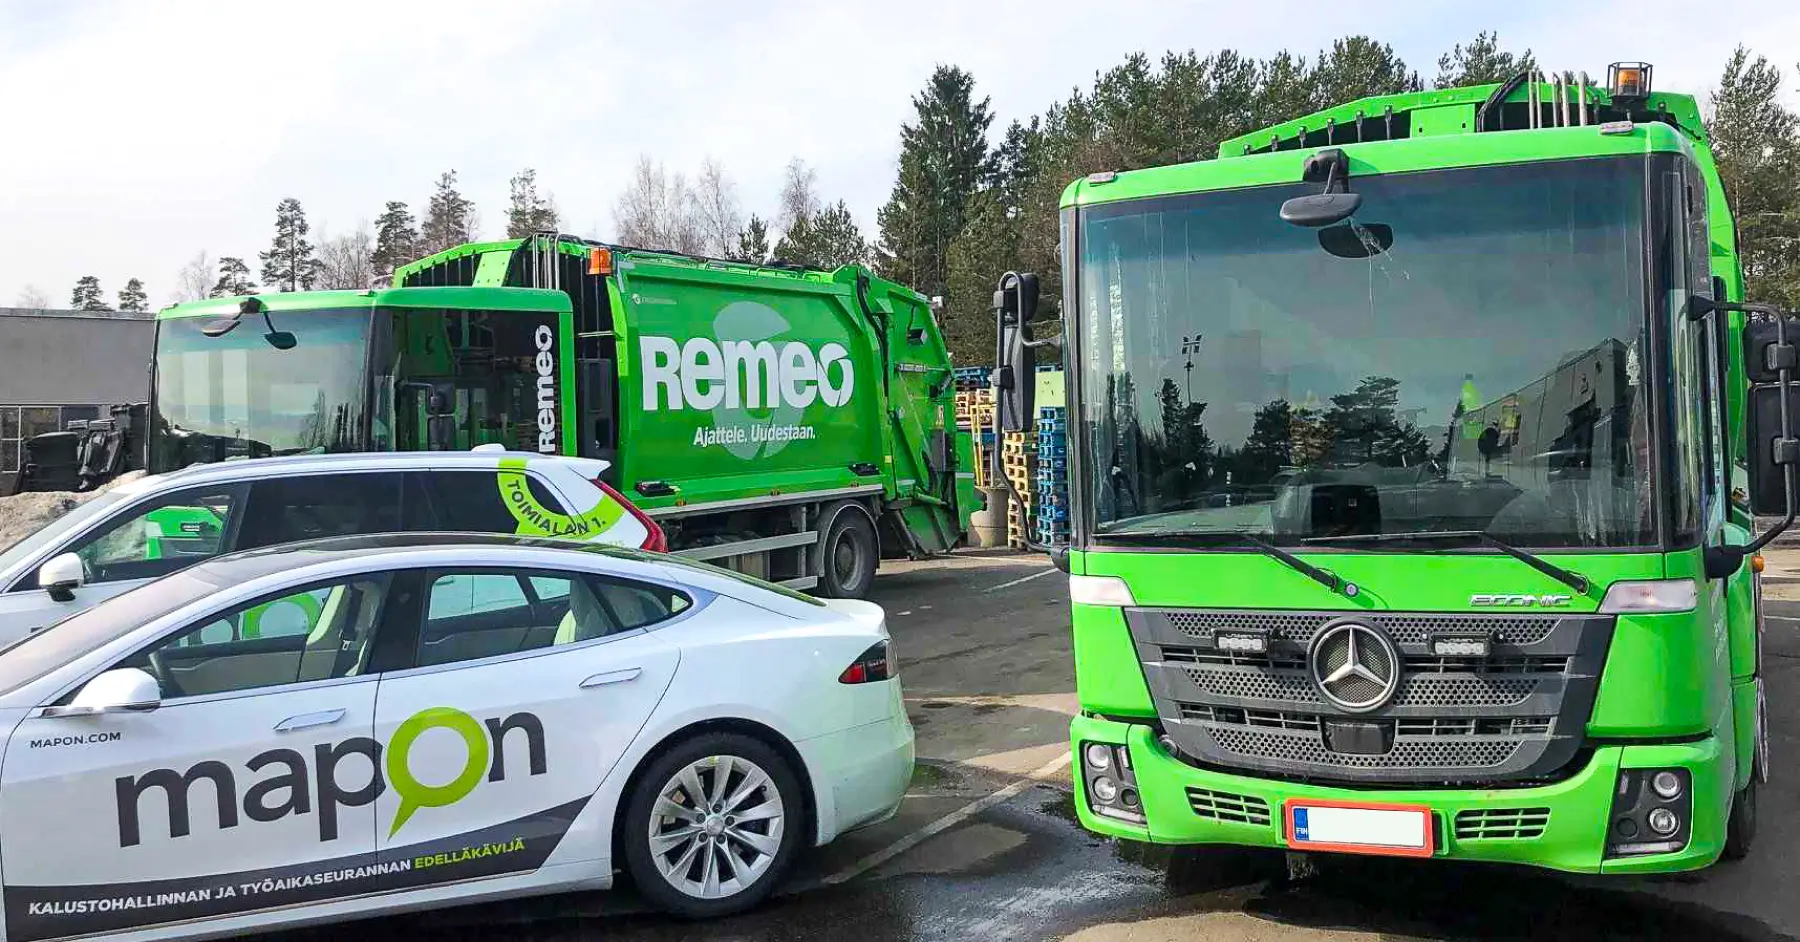


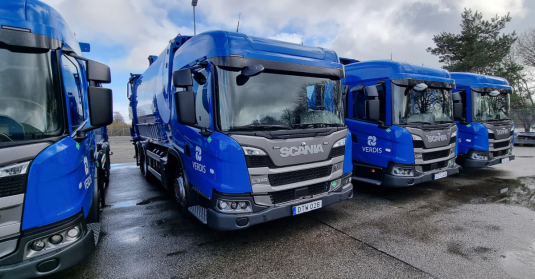


Verdis operates a large waste collection fleet across the Nordics, with around 1,500 vehicles in total and 350 in Sweden alone. Verdis Sweden plans to double their fleet size by 2027.
Growth at that scale creates pressure. More vehicles mean more drivers, more data, and more potential for inefficiencies. For Verdis, the issue wasn’t a lack of data. It was the data scattered in multiple systems.
After moving to one platform and building a routine around driver coaching, they gained full control and cut fuel costs by 10%.
Here’s how they did it, according to Ronnie Andersson, Fleet Manager at Verdis Sweden!
The Problem — Too Many Systems, No Clear Picture
Verdis handles waste collection and transportation with over 500 employees and 350 vehicles in Sweden.
Before implementing Mapon, they used multiple telematics systems across different vehicle brands. Ronnie explains the struggle they had:
“Previously we had five different systems. It was really hard to compare one driver from another.”
Each manufacturer reported data differently. A driver in a Scania and a driver in a Volvo could not be evaluated on equal terms. Fuel consumption data was inconsistent. Behaviour metrics were not directly comparable.
This made daily management way harder than it needed to be. Instead of focusing on improvement, their teams spent time trying to understand the data itself.
The System — One Platform Across the Entire Fleet
Their goal with Mapon was clear: one unified system to manage all drivers and the whole fleet regardless of vehicle manufacturer.
What started as a way to monitor fuel consumption and detect diesel theft became the central system for fleet management. Managers no longer need to switch between tools or interpret conflicting metrics.
This brought reliable comparisons and a real opportunity to save fuel. Now drivers, vehicles, and routes can be evaluated using the same criteria.
The Behaviour – From Data to Daily Action
Data alone doesn’t change anything. Verdis built a consistent routine around it.
Managers check the fleet data daily. Each depot has a site manager responsible for monitoring specific vehicles and drivers. Ronnie describes the process:
“We have a weekly check where we print the reports and discuss them with the drivers in detail.”
These weekly sessions are structured and consistent. Managers start with the overall driving score. If the score is low, they go deeper into specific events – harsh braking, acceleration, and other patterns that increase fuel use or safety risk.
The map view is used to recall and review real situations.
“When we bring up a questionable event in the route, drivers always say first that something is wrong in the system… but then we check the map and route, and they remember what happened and why.”
This removes guesswork. Drivers and managers see the exact moment and context behind each event.
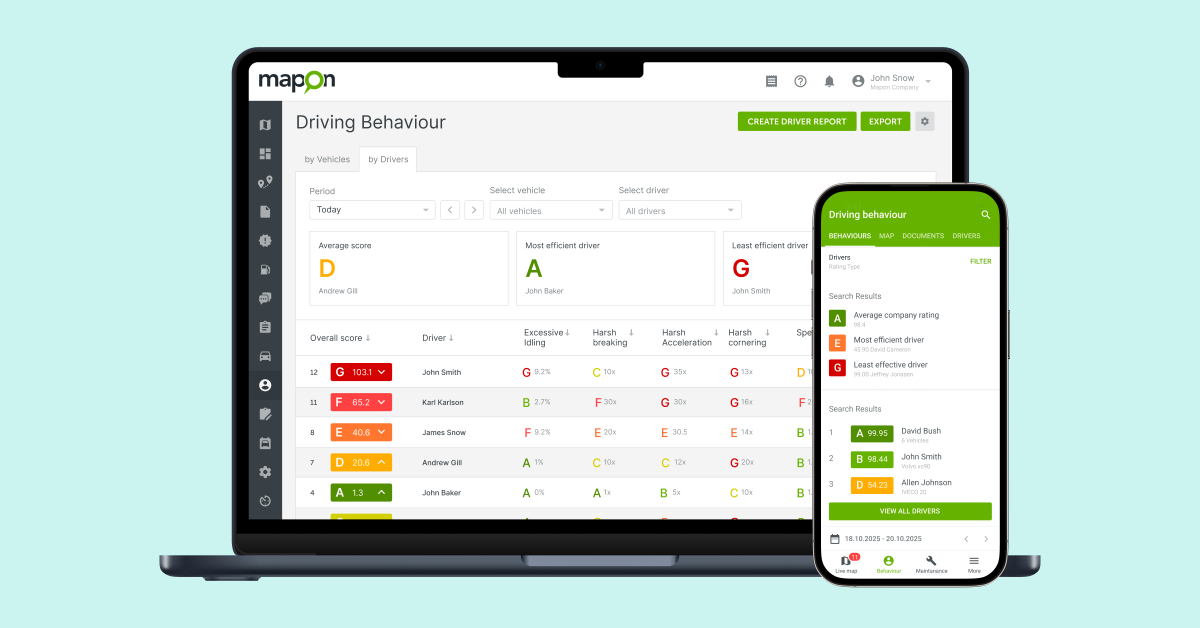
The Mapon platform and apps give a clear overview of driver behaviour in one place.
Financial Incentive: Linking Driver Behaviour to Pay
From April 2026, Verdis Sweden introduced a direct link between driving behaviour and salary. Drivers receive a fixed hourly rate plus a variable bonus based on performance.
In the Mapon system, driver performance is calculated from driving data automatically — including harsh braking, acceleration, and overall driving score. These are the same metrics used in weekly coaching, so expectations stay consistent.
“We want to motivate our drivers to drive safer and use less fuel. With the bonus system, they can affect their pay with their own choices behind the wheel.”
In practice, this changes how drivers approach daily work:
-
every trip affects the final pay
-
small improvements add up over a full month
-
consistent safe and efficient driving is rewarded, not just occasional good results
Instead of general feedback, the discussion becomes concrete and driver-specific. This turns driver behaviour from subjective opinions into something clearly measurable and visible. Drivers can see how their score evolves and understand what actions improve it or decrease it.
Fuel consumption remains the core reference point.
“We are focusing on fuel consumption. If we use less fuel, we save money.”
Driving behaviour is treated as the main lever behind that result.
The Results — Measurable Savings and Clear Impact
The impact became visible quickly.
“We saved around 10% of fuel within four months since we started using Mapon.”
This reduction came without changing the fleet. The improvement was driven by visibility, coaching, and consistent follow-up on driving behaviour.
What Actually Changed
Fuel savings did not come from a single action. They came from a combination of small, repeated improvements:
-
less unnecessary idling during stops
-
smoother acceleration instead of aggressive starts
-
earlier braking instead of last-moment stops
-
better anticipation in dense city traffic
These are routine behaviours that only stick with regular checks and coaching.
Because waste collection follows fixed daily routes, the effect is easy to observe. The same routes are driven every day, which makes inefficient habits visible — and improvements measurable.
How Savings Scale in Practice
Even small, repeated improvements behind the wheel can significantly reduce fuel costs over time. Across hundreds of vehicles operating daily, the impact adds up.
With Mapon, Verdis can compare performance across depots and drivers — making it easier to replicate what works well and avoid repeating the same inefficiencies fleetwide.
What does a 10% cut in fuel consumption mean for the bottom line?
Verdis’ fleet of 350 vehicles drives approximately 354,000 kilometers per month. With diesel in Europe averaging around €1.60 per litre (under normal market conditions), fuel is one of the largest operating costs. Waste collection trucks typically consume more than regular trucks due to stop-and-go driving and the use of PTO while lifting the bins.
A 10% reduction in fuel consumption translates into approximately €24,900 in monthly savings — or nearly €300,000 annually.
The link between behaviour and cost is clear inside the organisation: harsh braking and acceleration increase fuel consumption and inefficient driving increases wear on brakes and tyres.
By focusing on behaviour first, Verdis reduces multiple cost drivers at the same time — not just fuel, but also maintenance and long-term vehicle wear.
Additional Control Over Operations
The platform improves visibility beyond fuel:
-
Fuel theft can be detected through consumption patterns and alerts
-
Route deviations can be identified by comparing planned and actual routes
-
PTO usage helps verify when waste collection actually takes place
-
Geofences to check which vehicles were present at specific locations, to solve damage cases or claims
-
Tachograph process is fully automated via Mapon’s remote data downloads and Tachogram analysis tool, helping Verdis stay compliant without manual or admin workload
Using Mapon and Tachogram systems replaced uncertainty with clarity in Verdis’ daily operations – for both managers in the office and drivers behind the wheel.
Ready for What’s Next — EVs and Energy Tracking
As Verdis expands its fleet, the focus is shifting toward electrification.
The company currently operates around 20 electric vehicles and plans to scale to 80–90 EVs in the near future.
With Mapon, energy consumption is tracked in the same way as fuel. This removes manual calculations when a waste company has to report to municipalities. In the Mapon platform, carbon footprint reporting becomes part of the same workflow as daily fleet management – with no additional devices or tools.
For Verdis, the same system supports both current operations and future requirements.
What This Means for Large Fleets
Verdis didn’t add more tools. They reduced complexity and built a routine around consistent data.
One platform made the data comparable, and regular checks made it actionable.
The result is clear: 10% lower fuel costs, consistent driver behaviour, and better control over fleet operations.
For companies managing large fleets, the takeaway is simple: Use data daily. Connect it to behaviour and incentives. Make the impact visible – especially in the bottom line.
Contact our team to calculate how much your fleet could save each month!