


Since 2020, Bertschi has used Mapon to gain a clearer view of driver behaviour across its fleet. What began as a way to better understand driving data has developed into a structured training process that has helped instructors identify patterns and support drivers more individually.
We spoke with Àngel Compte, Safety Instructor and Head of Driver Behaviour Analysis for Spain, Italy, and Portugal, to understand how data-driven training has reshaped driver training over time, and promoted safer and more efficient driving habits.
Why driver behaviour is key at Bertschi
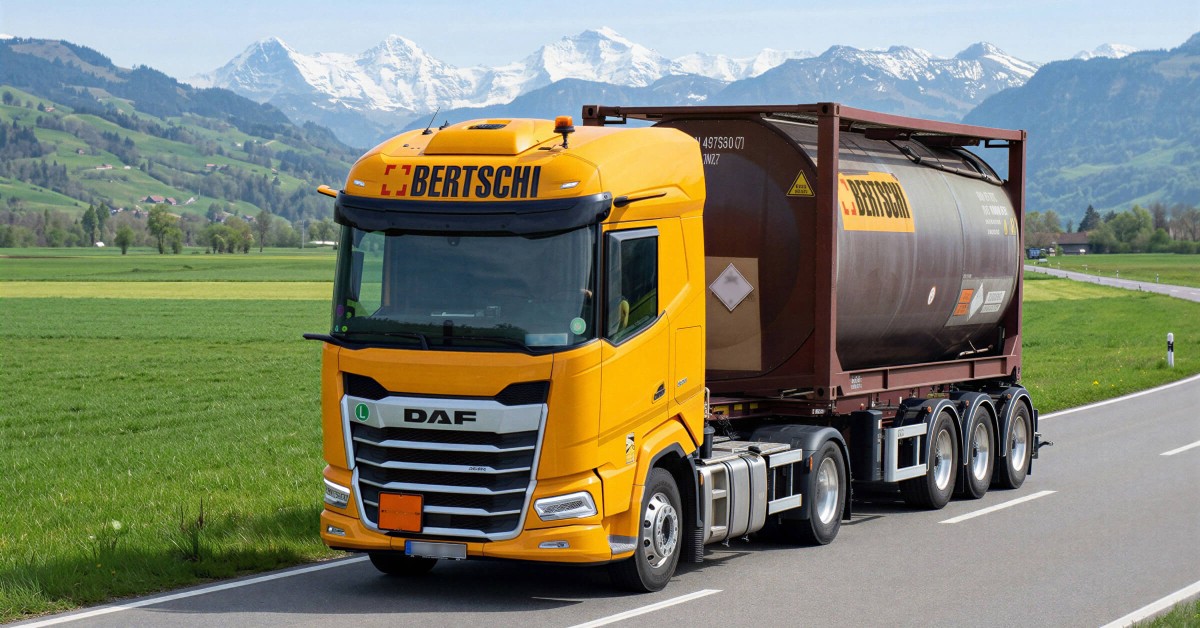
Bertschi is a Swiss logistics company specialising in the transport and handling of chemical products. In chemical logistics, products are often sensitive, regulated, or classified as dangerous goods, and a driver’s decisions on the road can directly influence safety, operational reliability, and environmental performance.
"Chemical transport is different from general cargo,” explains Compte. Our drivers are handling products that require discipline and a high level of responsibility. That is why we look closely at how the vehicle is driven, not only whether it arrives on time."
Driver behaviour is a key part of this system.
What has changed in six years
When Bertschi first started working with Mapon, the system was mainly used for tracking and data collection. Today, its data has become part of everyday driver training.
Àngel and his colleagues use the platform to identify where support is needed, prepare targeted training sessions, track individual progress, and recognize patterns across countries and subsidiaries. The improvement is also reflected in the results.
"We can now see much more clearly where progress is being made,” says Àngel. “Today, the number of drivers reaching the top score categories is significantly higher, which shows that consistent follow-up and training can make a real difference."
How data is used on a daily basis
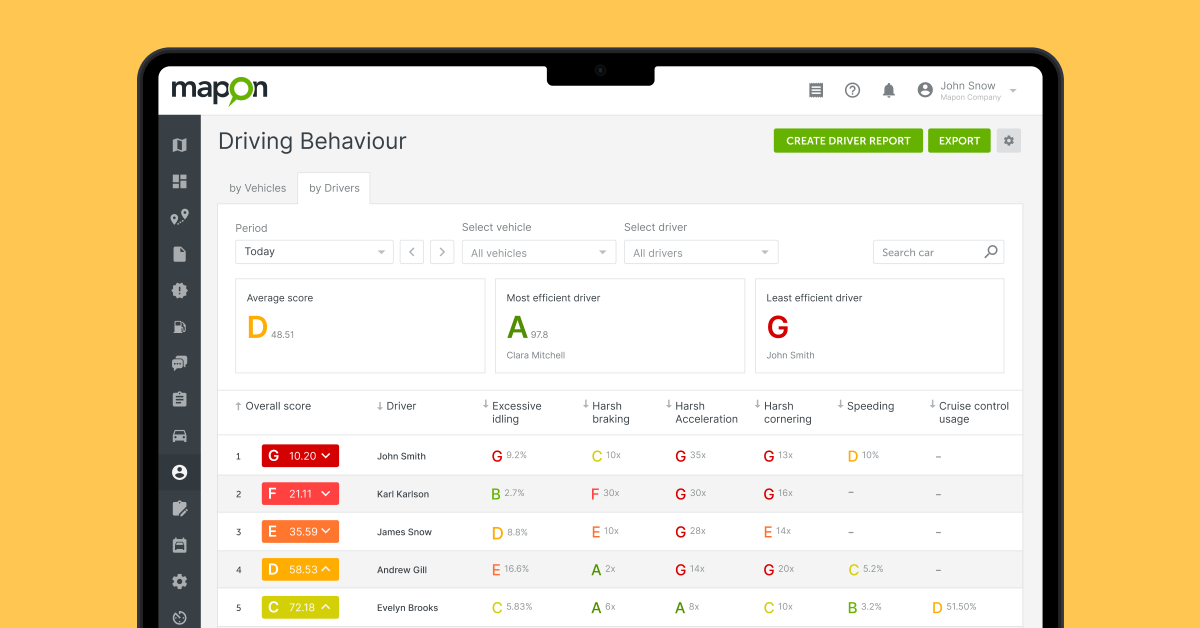
At Bertschi, the analysis of the Mapon data focuses on four key indicators:
- speeding
- excessive idling
- coasting
- cruise control usage
Together, these indicators help instructors see where further training is needed. For example, excessive idling may point to fuel-saving opportunities, while low coasting or limited cruise control use can show where a driver could make better use of anticipation and vehicle
technology.
"Mapon helps us see patterns that drivers may not notice themselves,” says Àngel. "That gives us a clearer basis for training."
How the data is used in practical driver training
One of the most important elements at Bertschi is how data is turned into action. Àngel, and the whole training team throughout Europe, works directly with drivers in their real working
environment.
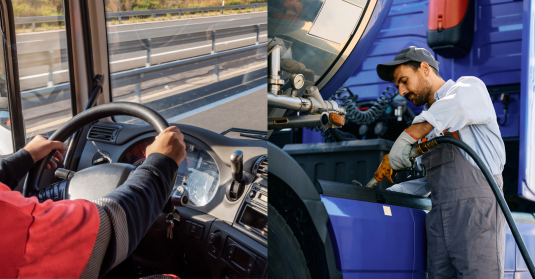
During these sessions, the driver trainer:
- accompanies the driver throughout the entire working day;
- analyses real-life situations (traffic, roundabouts, slopes);
- corrects decisions on the spot;
- reviews the data at the end of the day.
This makes the feedback more concrete.
“We’re not here to tell someone they’re driving badly. This entire process allows us to guide them towards changing habits. Sometimes a driver starts the day with a score of 70 and finishes with 90. When the driver sees the connection between the situation, the driving behaviour, and the result, the feedback becomes much easier to understand.”
Results: better driving habits and real fuel savings
Over the past few years, Bertschi has taken significant steps to improve operational efficiency across its fleet, focusing on one often-overlooked factor: engine idling.
Back in 2020, the company's vehicles averaged around 40 minutes of idling per day. Through consistent monitoring, targeted driver training, and the smart use of data collected through Mapon, Bertschi successfully reduced this figure to approximately 15.5 minutes per vehicle per day by 2025.
This marks a substantial improvement, delivering both environmental and economic benefits.
A key contributor to this progress has been the ability to leverage detailed fleet data. Using insights from the Mapon platform, Bertschi has provided drivers with focused, practical training, helping them better understand and actively reduce unnecessary engine runtime in their daily operations.
The results speak for themselves. Over the past two years alone, Bertschi has reduced fuel consumption across its fleet by 0.3 litres per 100 kilometres. At a time when diesel prices have increased significantly, this improvement in efficiency has translated into meaningful cost savings for the company.
Reducing idling may seem like a small change, but its impact is substantial. Lower fuel costs, reduced emissions, and longer vehicle lifespans demonstrate how data-driven fleet management can create lasting value across an entire operation.
How driver perception has changed
At the beginning, some drivers interpreted the addition of Mapon as some kind of control tool.
That changed, however, when the data became part of their practical training.
“At first, some drivers thought the system was there to check on them,” says Àngel. “But when we review the data together, they can see where small adjustments make their work easier and improve their score.”
Mapon as a daily tool at Bertschi
After six years, Mapon has become part of Bertschi’s regular driver coaching process. Driver behaviour data is used to identify improvement opportunities, prepare tailored training, track progress, and detect risks before they lead to incidents.
“Mapon is a good tool. It helps us see where we can improve and work with drivers in a more focused way,” says Àngel. As Àngel puts it: “Mapon gives us safety, savings, and efficiency.”
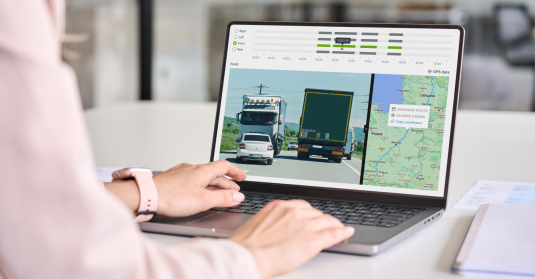
Bertschi continues to evolve its fleet management approach. Among the next steps, the company is evaluating new solutions such as videotelematics, which will allow them to analyse specific situations on the road and complement driving data.
The goal remains the same: better understand what happens on the road and keep improving safety.
Want to improve your fleet efficiency?
The Bertschi case shows that improving driver behaviour doesn’t require major structural changes. Results come from combining clear data, continuous monitoring, and training based on real-life situations. This makes it possible to identify inefficient habits, correct them, and measure the impact over time.
If you’re looking to reduce costs, improve safety, and gain better visibility into what’s happening across your fleet, driver behaviour analysis is a great place to start. Get in touch with our team and find out how to apply this approach to your fleet.